
1. Version Information
2. Document Purpose & History
This document describes how to export a report, or a specific part of a reports.
Exporting Reports
After you filter a report to display the information you require, you can export the report as a whole using the export button  . Thsi will export the entire report as a pdf report. Depending on your browser settings, this will either be saved to your downloads folder, or you wll be given the option to save the pdf file to a location and with a specific filename.
Report Elements
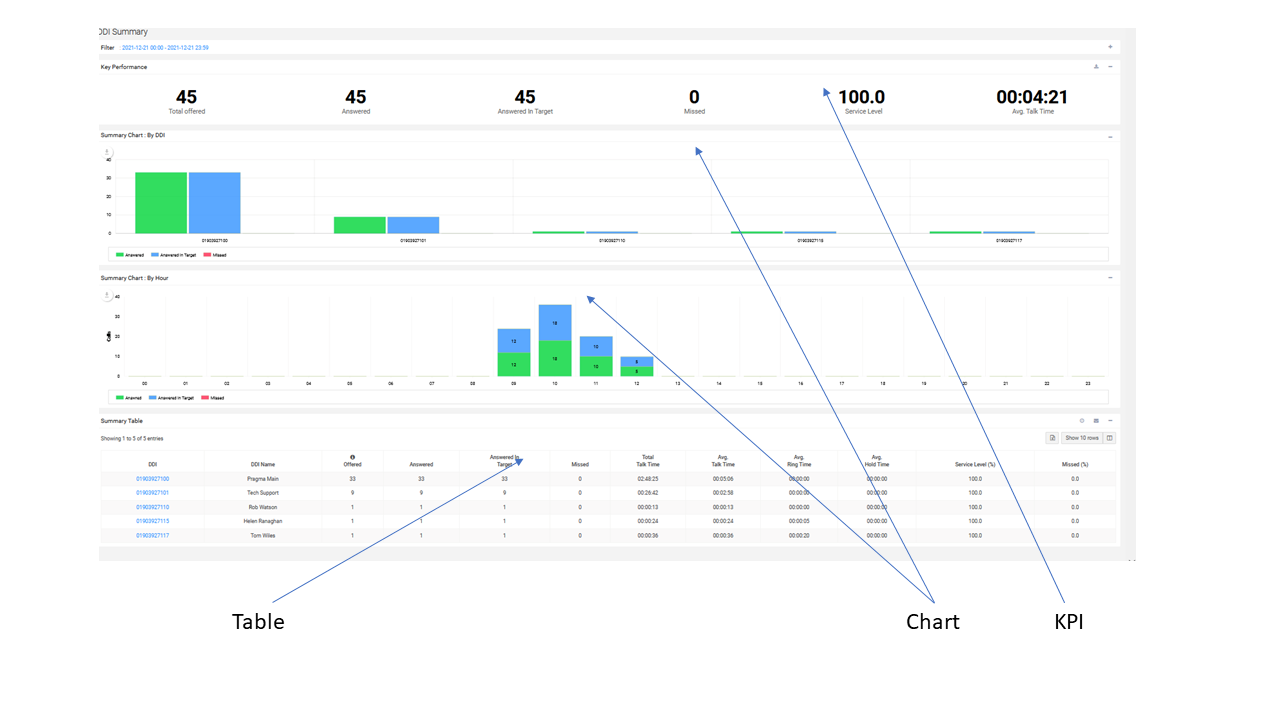
There are 3 different elements that make up the Summary Reports. Call Detail and other reports do not necessarily have all 3 elements.
- KPI – These are the aggregate/calculated values for all the rows of the table of the report, e.g. all the extensions in the table for an Extension Summary Report.
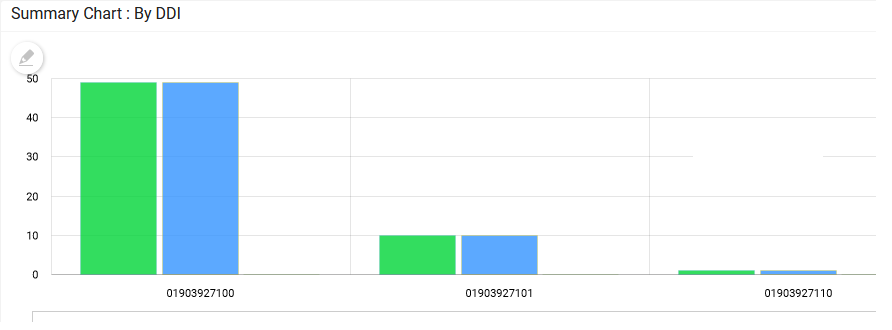
- Charts- Graphns, and Charts of the data in the Data Table
- Table – The raw data that the other 2 types of elements are produced from.
Exporting Data Tables
The data table can be exported using the  button. Before exporting the table, you can shoose to include or exclude columns using the
  button. The table will be exported as a Microsoft Excell spreadsheet (xlsx) file. Your browser will either save the file, allow you to open directly in Excell, or save to a location you specify, depending on settings.
Exporting Charts
The button is used to export a chart element. This is located on the left of the chart, under the chart title. Hover the button and it will turn selected (white on black background), and a menu will appear.
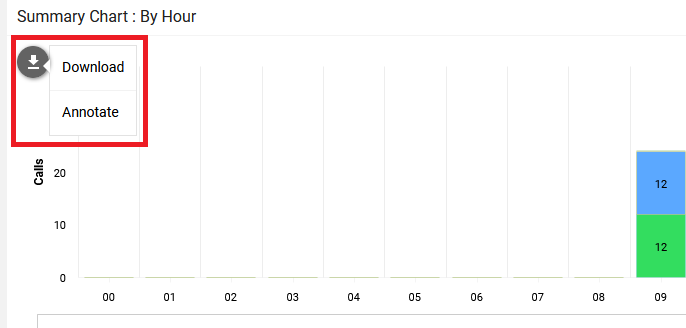
The Annotate Option lets your “draw” onto the chart before downloading. Use your mouse to draw or write a quick message on the chart before downloading. This avoids having to open an image manipulation package to add text to the exported chart graphic.
If you hover over the download button again, or choose download rather than annotate in the first place, you can download the chart as a png or jpeg file.
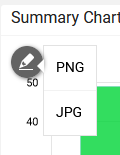
Depending on your browser setting this will be saved to your dowloads folder, or allow you specify a location.
Exporting KPI Information
The  button allows you download all the KPI values as a png graphical file.
Alternatively you can select the text and copy onto the clipboard if you wish to have the values as text, and are not worried losing the format.
- Select the value or values you require, whislt pressing the left mouse button, drag over the values to hi-light (the titles will also be hi-lighted).
In this example, missed and service level have been hi-lighted.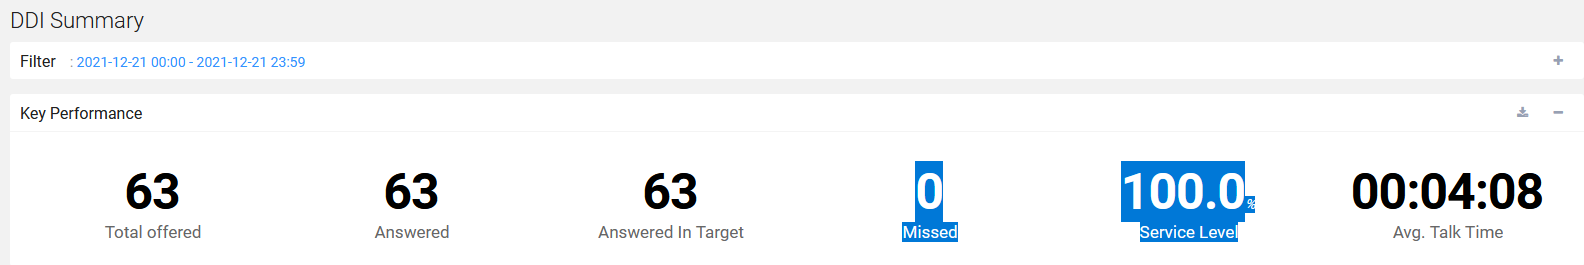
- Press Ctrl+C together to copy the selected text onto the clipboard.
- In your target application, paste the clipbaord content.
Note: If you paste into Excell, the values will be pasted vertically (transposed), rather than horizontally.
“

Leave A Comment